Metaphors for Understanding Born Digital Collection Access: Part III
Kathleen O’Neill is currently serving as one of two Staff Innovators at the Library of Congress. Their 2020 project, Born Digital Access Now!, explores existing pathways for accessing born digital materials in the Manuscript Division. In this series of blog posts, Kathleen describes the complexities of gaining access to born digital materials through the lens of three different metaphors.
Up first was “Media Format, or, Have Fun Storming the Castle!” The second blog post discussed “Legacy File Formats and Operating Systems or Lost in Translation.”
This is the third and final post in the series and Kathleen carefully explains the process of emulation and makes it feel less like “strange magic.”
Emulation or Strange Magic
As an archivist, I love to give show and tells of collection material. There are collection items that regularly induce gasps of surprise, delight, or even sorrow. Archival materials can inspire our imagination and enrich our understanding of an historical event or person. Most archivists have favorite collection items they like to share. Before the Lorenz papers, there were few born digital collection items that seemed suitable for a show and tell. Perhaps we are too immersed in digital content to have any sense of wonder about .doc files.
Arthur C. Clarke, futurist and author of 2001: A Space Odyssey, wrote three rules known as Arthur C. Clarke’s laws. The third rule states that “Any sufficiently advanced technology is indistinguishable from magic”. The Edward N. Lorenz Papers contain early data visualization software that is, by Clarke’s law, magic. Magic? Yes, magic in a science collection of all places. The software is magical in the sense that it engenders wonder, awe, surprise, and even beauty.
If you couldn’t tell already, the data visualization software applications from the Edward N. Lorenz papers are on my list of favorite collection items. They provide an eye-catching way to illustrate the importance of emulation tools, which are used to imitate obsolete or arcane operating systems; the complexity of modern digital files; and the means to tell a great story. Are they magic? You tell me.
Before we get to the data visualization software, let’s take a look at a few items from the paper portion of the collection.
Edward N. Lorenz Papers
Edward N. Lorenz was a mathematician and meteorologist, best known for his contributions to the development of chaos theory. Working with computer models of weather systems, he rounded results of a simulation from six decimals places to three, then repeated the simulation, and unexpectedly, this small change to the data yielded markedly different results. Lorenz had the insight that small changes in initial conditions can have profound impact on outcomes over time, causing results to be unpredictable. When plotted, the results of Lorenz’s attractor equations took the shape of a butterfly, one of the reasons the phenomena came to be known as “butterfly effect.”
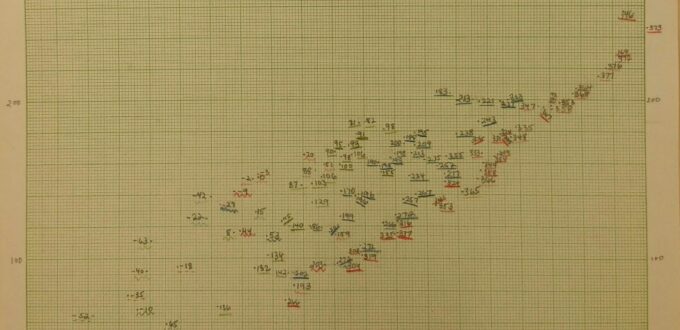
The Edward N. Lorenz Papers contains a Science File series, a mere two boxes (Boxes 14 and 15), that hold charts, graphs, and slide presentations. These materials contain not only data, but also evidence of the intensive labor involved in scientific pursuit. Figure 1 is a hand plotted chart; one can only imagine the time it took to accurately compile and plot this data.

Fig. 1 Scatter chart. Box 14, Edward N. Lorenz Papers, Manuscript Division, Library of Congress, Washington, D. C.
These charts and visualizations also illustrate how the visualization tools available to scientists impose spatial limits on the visualizations themselves. In Figure 4, the image of the Lorenz attractor data is truncated by the physical limits of the graph paper. When I saw these pages, I imagined Lorenz laying out pages on the floor and piecing them into a larger image, like a mosaic. Furthermore, the data, of course, is static. Data points on a graph paper cannot convey the phenomena of the butterfly effect dynamically as it develops over time.

Fig. 2 Lorenz Attractor data. Box 14, Edward N. Lorenz Papers, Manuscript Division, Library of Congress, Washington, D. C.
The paper portion of the Edward N. Lorenz papers was processed by Joseph K. Brooks with the assistance of Brian McGuire and Jewel McPherson in 2013. The digital portion of the collection was set aside until 2018 when the Manuscript Division had the tools and workflows in place to process the 5.25” floppy and personal computer in the collection.
The collection contained data visualization software on 5.25” floppy disks sent to Lorenz by several scientists including Mahlon E. Kriebel, Mike Page, Jim Holsapple, E. Atlee Jackson, and James A. Yorke. These were Disk Operating System (DOS)-based data visualizations created by the sender using Lorenz’s and/or Otto Rossler’s attractor data. While I tackled processing Lorenz’s computer, digital conversion specialist Amanda May was able to recover the data from 5.25” floppy drives. She succeeded in opening the files in the text editor Notepad, but the software could not run in a modern computer operating system. Amanda May determined the software required emulation to imitate the older operating system. The tool we used was a DOS Box emulator.
What is emulation? In an archival context, emulation is a preservation strategy that focuses on maintaining access to digital content using the original files, as opposed to migrating legacy files to modern file formats. An emulator is the hardware or software that allows a computer to run software designed for another operating system. One of the advantages of emulation is that it preserves the look, feel, and functionality of the digital object in its original context. Remember the previous blog post, when the Windows operating system could not render the files from a legacy operating system? The DOS Box emulator allows a modern computer with a Windows operating system to behave like a DOS operating system. (For more information about emulation and other digital preservation strategies, see https://www.dpconline.org/handbook/organisational-activities/preservation-action).
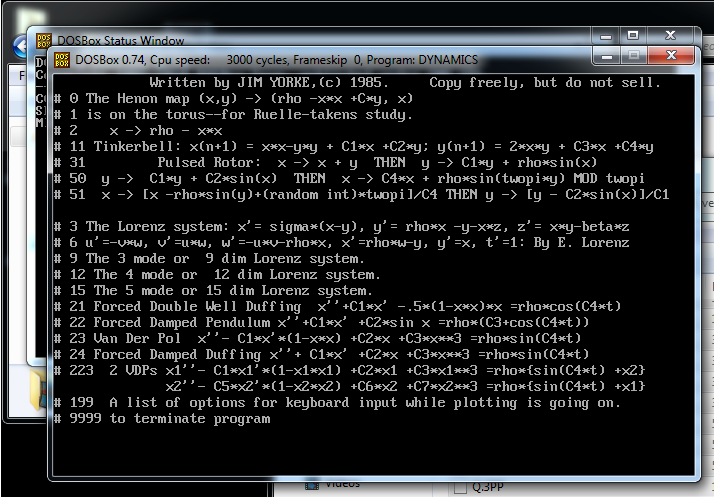
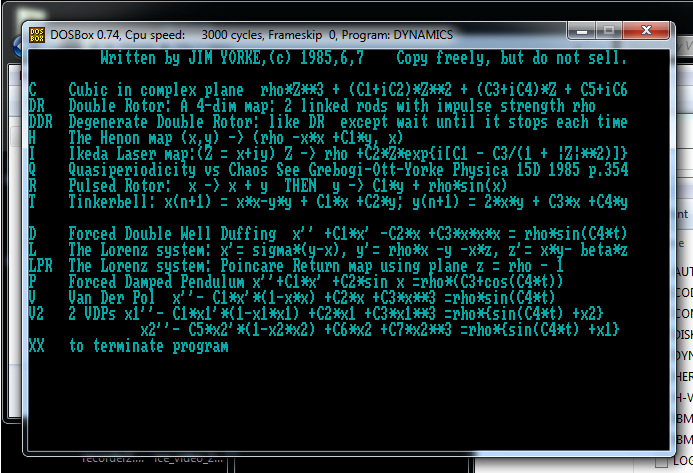
James A. Yorke, former chair of the Mathematics Department at the University of Maryland, College Park, sent Lorenz two 5.25” floppy disks, one in 1985 and the other in 1987. Using DOSBox v.047, Amanda May was able to open the software. See Figures 3 and 4 below for the opening menus for each software. Unfortunately, neither software responded to input commands. We were tantalizingly close to getting the software to run. Why wasn’t DOSBox able to run the content? It’s hard to say. The software might have other file dependencies or DOSBox v.047 might not be the appropriate emulator to run the software. None the less it was an exciting beginning.
-

- Fig. 4
Dynamics by J. Yorke, 11/16/1987
mss85426_059_003, Edward N. Lorenz Papers, Manuscript Division, Library of Congress, Washington, D. C.
-
- Fig 3.
Dynamics 12/85 with Lyap.
This computes up to 3 exponents for process #6
mss85426_060_002, Edward N. Lorenz Papers, Manuscript Division, Library of Congress, Washington, D. C.
Amanda May was able to get the data visualization software that Mike Page and Jim Holsapple created for Mahlon E. Kriebel to run using DOSBox v.074. The screen capture below shows the program opening to a main menu and then running the visualization for both the Lorenz attractor data and the Rossler attractor data. Seeing the data dynamically displayed is an entirely different experience than looking at the static data on paper. I can only imagine what it might have been like for Lorenz to see the data he plotted in the early 1960s moving through both time and space.
Video 1: Chaos Software v.1.1 by Mike Page and James Holsapple. mss85426_060_003, Edward N. Lorenz Papers, Manuscript Division, Library of Congress, Washington, D. C.
What you see above is a screencast of computer program from early 90s with several windows. Throughout the video, different options are selected generating data visualizations using purple lines on black background. The options selected include the Lorenz attractor data displayed as one trajectory, one trajectory (stereoscopic), multiple trajectories (stereoscopic). The Rossler attractor data is then displayed with the same selection of trajectories.
Well? Now you’ve seen it. What do you think? I’m still transfixed watching the program run.
Digital processing lesson: Well, obviously, the lesson is that it really helps to have Amanda May working with you. And to be honest, if I highlighted a different collection, there would be another colleague, archivist, or technician that offered their expertise to help me process born digital material and expanded my own knowledge along the way.
There is another reason why the Lorenz attractor software remains a favorite item. I finished processing the digital files from the Lorenz papers in the fall of 2017, right as Jer Thorp, the Library of Congress’ inaugural Innovator in Residence, began his residency with LC Labs. On his first day at the Library, he toured the Manuscript Division and as part of the show and tell, I ran Page and Holsapple’s Lorenz attractor software. Inspired, Jer Thorp created his own attractor but instead of feeding the program data points, he ran the attractor against a corpus of 3 million words. He used the path of the butterfly shape to generate word streams that read much like poetry. In this final presentation, Jer and I discuss his creative process and watch his attractor software running (the Lorenz discussion begins around 46 minute mark).
Jer’s attractor has elements of wonder and beauty. By using scientific equations to create poetry, he performs a kind of alchemy on the Lorenz attractor, transforming it to show us randomness and chaos in a new context. See? Magic!
Conclusion
I hope these processing adventures gave you a sense of the challenges archivists face when trying to get access to digital content. Also I hope you are beginning to get the sense that access does not come in one form. There are levels of access and often complete access requires extra processing and specialized tools. The next blog post from the 2020 Staff Innovator project team will cover the file formats in our holdings and how file format impact access and preservation.
Note: this post has been slightly edited for clarity.
Source of Article