Visualizing Book Challenges
Libraries are facing a record number of attempts to restrict access to books and other library materials. In the first eight months of 2023, ALA’s Office for Intellectual Freedom (OIF) reported challenges against 1,915 titles in libraries. This pace is expected to eclipse the record set in 2022, which saw 2,571 titles challenged.
To help visualize these historic censorship attempts, OIF has created a series of infographics to help explain the current state of material challenges—and to give historical context.
These infographics include:
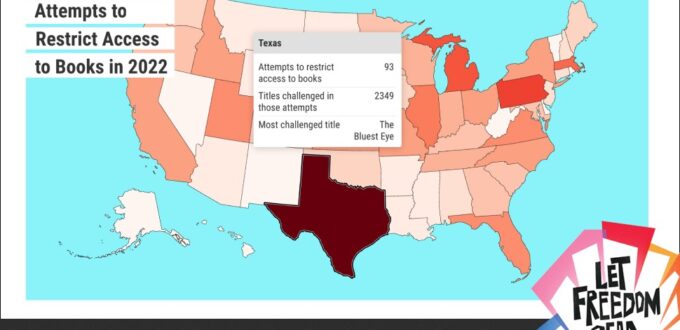
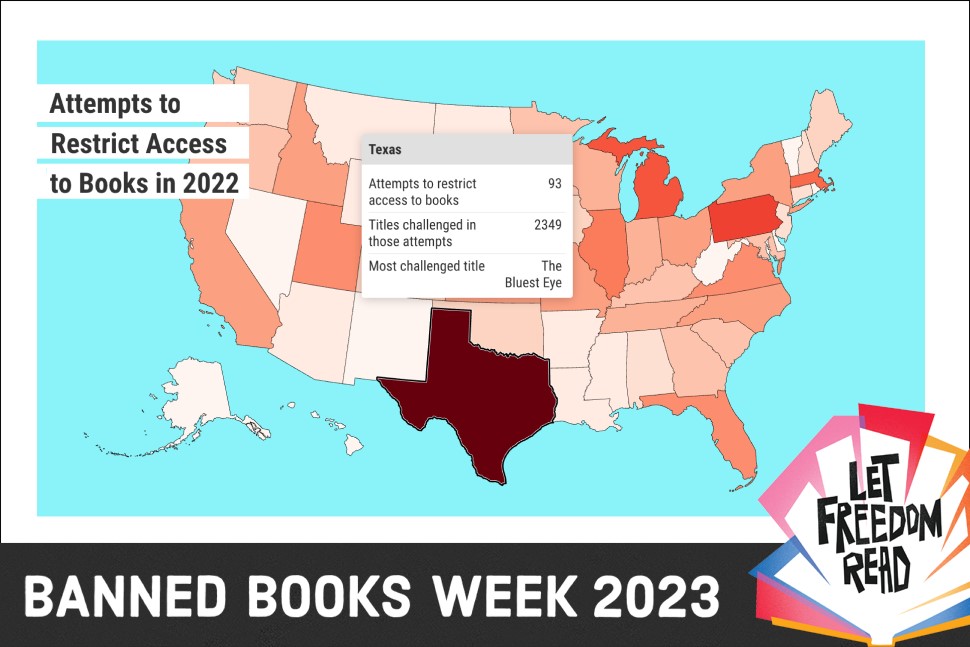
- A heat map showing how many attempts to restrict book access take place in each state every year. This map dates back to 2013, demonstrating the spread of, and trends related to, book challenges. While this recent wave of censorship attempts have generally targeted materials by or about members of the LGBTQIA+ community or Black people, Indigenous people, and people of color, 2013’s most-challenged books were the Captain Underpants series by Dav Pilkey.
- A graph of the materials subjected to challenges. While books, graphic novels, and textbooks account for 82% of challenges, would-be censors also challenge displays and exhibits, programs and meeting rooms, films, and other resources.
- A chart depicting the source of challenges to library materials. Parents launch the most challenges, but political or religious groups are responsible for more than one-sixth of challenges.
- A graphic showing the venues of challenges. Nearly all demands to restrict materials occur in public libraries or school libraries or classrooms.
See all of OIF’s infographics.
Banned Books Week takes place Oct. 1–7.
Source of Article